
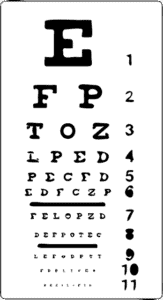
An eye chart is a standardized chart featuring letters, symbols, or shapes in decreasing sizes. It is used to measure how far you can see. The purpose of the eye chart is to test your ability to see objects at a distance, which is called visual acuity. The most famous eye chart is the Snellen chart, which consists of rows of letters that decrease in size as you move down the chart.
Moreover, you can use our eye chart to help you make a more accurate diagnosis. In fact, studies have shown that visual aids can improve diagnostic accuracy by as much as 40%. Sounds good, right?
This guide covers different types of eye charts like Snellen, Tumbling E and Jaeger chart and tips to use them at home for accurate vision testing.
What are Eye Charts ?
Eye charts are tools to measure vision at a fixed distance. They are designed to test visual acuity by having the person identify letters or symbols from a standardized distance, usually 20 feet or 6 meters.
The most common of these charts is Snellen eye chart but there are many others, each for different purpose and testing condition.
Visual acuity testing using eye charts has become popular for home use and with proper setup these tests can be as accurate as clinical tests.
Snellen Eye Chart Overview
Snellen eye chart developed by Dutch ophthalmologist Hermann Snellen in 1860s revolutionized the standardization of vision testing. Before its creation, eye care providers used different charts and got inconsistent results.
Snellen chart has rows of letters that decrease in size and challenges the viewer to read the smallest letters they can. Snellen chart can measure monocular (one eye) and binocular (both eyes) snellen visual acuity making it a versatile tool for eye exams.
This chart is necessary for evaluating vision clarity and to determine legal blindness which is 20/200 or worse.
A study released in 2015 looked at how a smartphone-based visual acuity chart compared to a regular 6-meter Snellen chart. Findings showed that smartphone apps are useful, but their accuracy isn’t always good. More research is needed to prove this, especially for people who have serious vision loss.
Tumbling E Eye Chart
Tumbling E eye chart is a modified Snellen test for people who cannot read letters like young children or illiterate people.
Instead of letters, this chart has series of E’s in different sizes and orientations which the patient has to identify by pointing to the direction of the E.Measurements from tumbling E chart is almost the same as from a standard Snellen chart.
This makes it a reliable alternative for visual acuity testing so everyone can have their vision tested regardless of literacy level.
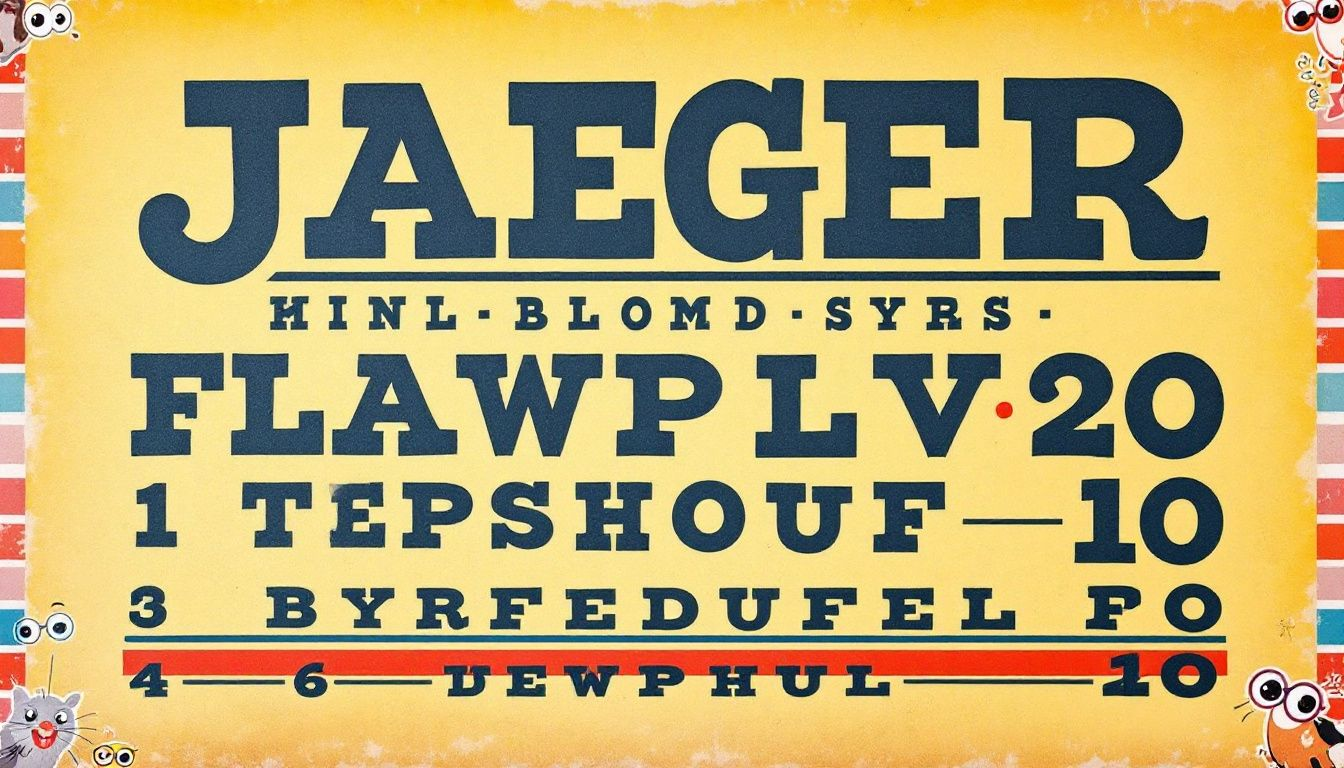
Jaeger Eye Chart for Near Vision
Jaeger eye chart is designed for near vision testing so it is essential for those who have difficulty reading up close.
This chart has short blocks of text in different sizes from J10 (largest) to J1 (smallest line) and J1 is the near vision equivalent of 20/20 vision.
Using Jaeger chart can help you determine if you need reading spectacles or reading glasses for other close up activities. Identifying the smallest text block you can read gives you insight into near vision capabilities and decide if you need further evaluation from an eye doctor.
LogMAR Chart
LogMAR chart is another specialized tool used in clinical research for its accuracy in measuring visual acuity.
This chart uses logarithmic scale of minimum angle of resolution (LogMAR) to provide more precise measurements than traditional charts.
As you can see, LogMAR chart has rows of capital letters that decrease in size similar to Snellen chart but with more standardized progression of letter sizes and spacing.
This makes it very useful for detailed visual acuity assessment especially in research settings as it uses capital letter format.
Read More: Why Do My Eyelashes Hurt? Causes and Remedies Explained
Jaeger Chart
Jaeger chart for near vision testing is a valuable tool to assess how well you can see objects up close.
Unlike Snellen chart which is for distance vision, Jaeger chart helps identify issues with reading or other close up tasks.
Jaeger chart is usually used in conjunction with other eye charts to assess your visual acuity. Whether you’re concerned about age related changes in vision or need to update your reading glasses prescription.
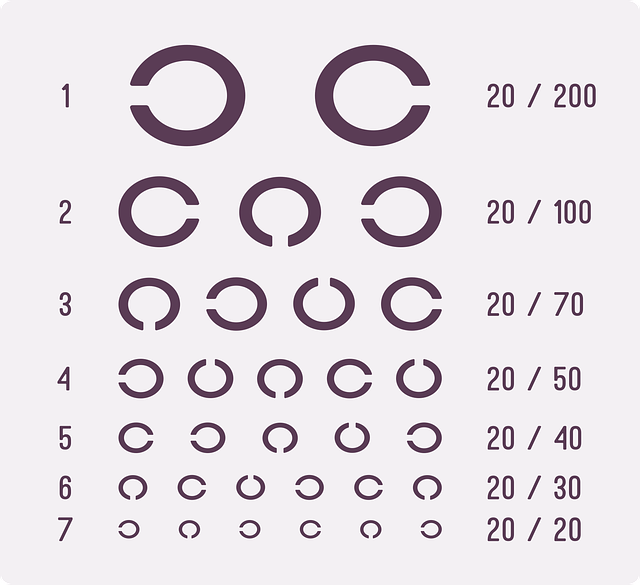
Landolt C Chart
Landolt C chart is used in specialized vision assessments and is very useful for people who struggle with letter based charts.
This chart has series of C-shaped rings (Landolt Cs) in different orientations and the patient has to point to the direction of the opening.
This chart is used in research and clinical settings to provide detailed analysis of visual acuity especially when standard charts are insufficient.
Its design helps to mitigate issues with letter recognition and literacy, providing a reliable alternative for diverse patient population.
Read More: Pink Eye vs Stye
How to Use an Eye Chart at Home
To get started, you need to set up the chart at 20 feet (or 6 meters) in a well lit room. Chart should be at eye level and correct lighting of 500 lux minimum is required for accurate results.
Follow these steps for a successful home eye test:
- Position yourself 20 feet away from the chart.
- Test each eye individually, starting with the weaker eye, by covering the opposite eye.
- If you cannot see the top letter from 20 feet, move closer in one-meter increments until you can read it.
- For charts with directional letters, indicate which way the open end of the letter is facing.
By following these steps, you can use eye charts at home to determine the smallest letters readable and monitor changes in eyesight.

Download Free Eye Charts
Downloading free eye charts is easy. At Allfit Well, we offer free Snellen charts and other types of eye charts that you can print on standard 8.5 x 11-inch paper for proper scaling. These free resources are perfect for at-home visual acuity testing.
Just click the image link on the website, save images on your device and print out the chart which is especially useful for children or family members that need regular vision monitoring without frequent eye doctor visits.
In fact, according to the American Academy of Ophthalmology, 75% of vision problems are detected in eye exams before any symptoms show up. Thus, even though home testing helps you monitor your vision, professional checkups catch serious problems.
Interpreting Your Results
20/20 is normal visual acuity, meaning you can see clearly at 20 feet what a person with normal vision can see at 20 feet. 20/15 means you can see details at 20 feet that most people can only see at 15 feet.
Only around 35% of adults have 20/20 vision without corrective lenses.
Here are the key points to help you interpret your results:
- Record visual acuity results as a fraction, example 20/20 or 20/40.
- Individuals are considered legally blind if their corrected vision is 20/200 or worse.
- Annual eye exams are important to monitor overall eye health and detect early signs of conditions that may not have symptoms.
- Eye exams can update optical prescriptions, improve clarity of vision with corrective lenses.
Read More: Why Is My Eyesight Getting Worse?
Limitations of Eye Charts
Eye charts are useful for measuring visual acuity but they have limitations. For instance, people not familiar with the Roman alphabet may find the Snellen chart difficult to use. Variations in letter size and spacing can also cause inconsistencies in measurements.
Eye charts don’t measure peripheral vision or other aspects of visual function like depth perception or refractive errors. Here are the limitations:
- Snellen chart is not effective in diagnosing depth perception problems.
- Patients with cognitive impairment may struggle with the test due to attention and cooperation requirements.
- Different Jaeger charts have varying text sizes, making comparisons unreliable.
- Regular visits to an eye doctor can detect underlying health conditions like diabetes and hypertension through eye exams.
Importance of Regular Eye Exams
Early detection through regular exams can prevent vision loss and ensure you have the most accurate prescriptions for glasses or contact lenses.
For those 50 and above, yearly eye exams are highly recommended due to increased risk of age-related eye conditions. Here are the benefits of regular eye exams:
- Detect early signs of eye diseases like glaucoma and macular degeneration.
- Get accurate prescriptions for glasses or contact lenses.* Monitor overall eye health, eye pressure and retina condition.
- Detect underlying health issues like hypertension and diabetes through eye exams.
- Improve vision clarity with updated corrective lenses.
- And of course, you must get professional eye care.
Eye Chart vs Digital Vision Testing Tools
When it comes to visual acuity testing, both eye charts and digital vision testing tools have their advantages.
Eye charts like the Snellen chart are widely used and easy to use for visual acuity measurement. But technology has introduced digital vision testing devices that are more accurate and convenient.
Digital tools can provide more detailed measurement and are often easier to use especially for those with mobility or literacy challenges.
While eye charts are still useful, digital vision testing devices can complement them, for a complete eye health assessment.
Wrap Up
With all of this in mind, eye charts are useful for visual acuity measurement and monitoring. From Snellen chart to Tumbling E, Jaeger, LogMAR and Landolt C, each has its purpose in testing different aspects of visual function. Home testing with these charts can be helpful but don’t forget to have it complemented with regular professional eye exams to have a complete eye health.


