The Snellen chart is an eye chart used to measure visual acuity. It has rows of letters getting smaller and smaller. Eye doctors use it to diagnose nearsightedness and farsightedness.
Of course, way back in 1862, a brilliant doctor named Hermann Snellen invented a way to check your eyes. While the Snellen chart is prevalent, other charts like the LogMAR chart are often used in research settings due to their more uniform letter progression and spacing.
According to the American Academy of Ophthalmology (AAO), people aged 65 and up should get their eyes checked every one to two years, even if they don’t have any signs. This way, problems can be found early and fixed.
Moreover, you can use our eye chart to help you make a more accurate diagnosis. In fact, studies have shown that visual aids can improve diagnostic accuracy by as much as 40%. Sounds good, right?
For this reason, we are here to show you the Snellen chart history, structure, and how to read the results of a Snellen test.
History of the Snellen Chart
The Snellen Chart was born out of necessity and innovation in the 19th century. In 1862, Dutch ophthalmologist Hermann Snellen created this chart, based on his colleague’s wall chart to measure vision. This was an era of industrialization and more people were working in occupations that required sharp vision.
Before Snellen’s innovation, eye care professionals used various charts and the results were inconsistent and unreliable. The Snellen Chart provided a standardized method and changed the way visual acuity was measured.
In addition to the standard chart, Snellen also created a ‘Tumbling E’ chart for those who cannot read, like young children or those with literacy issues. This further showed the practicality of his invention and cemented the Snellen Chart’s place in ophthalmology.
Structure of the Snellen Eye Chart
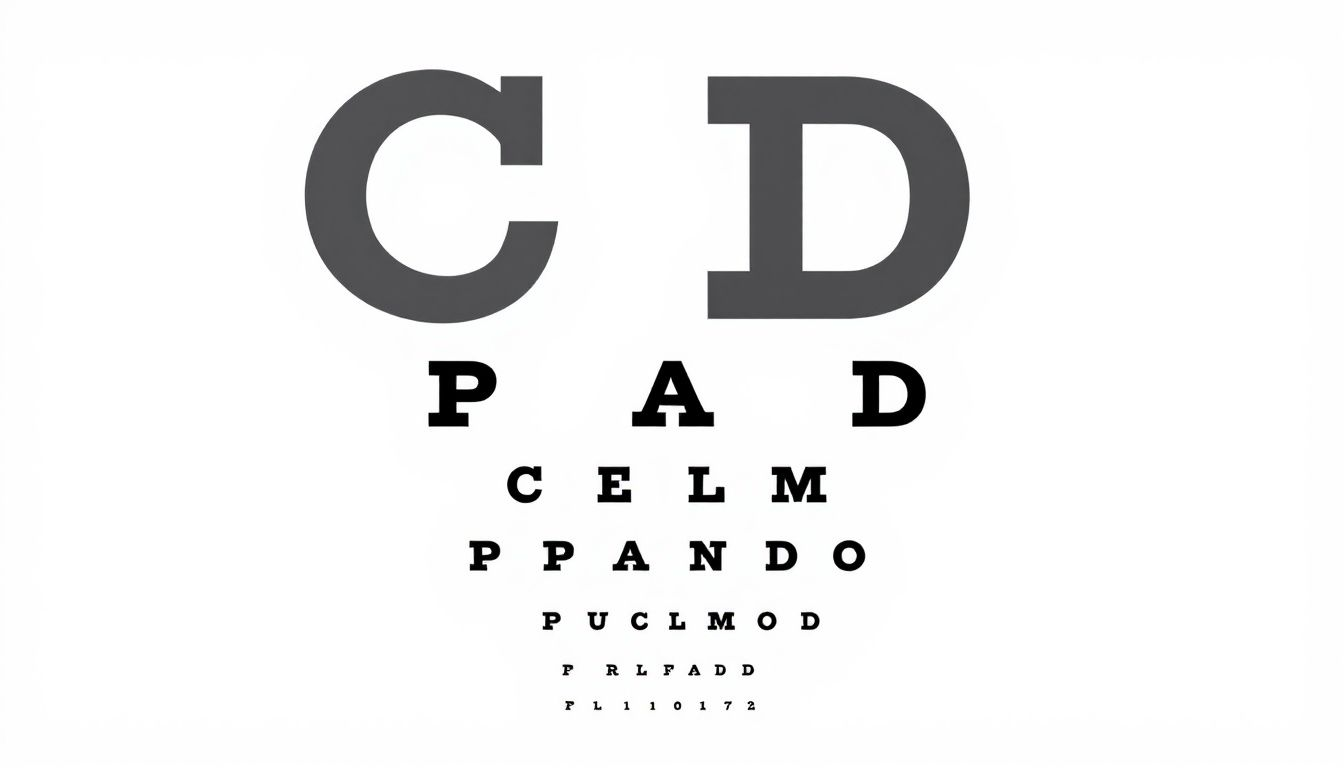
The Snellen Eye Chart is simplicity itself. It has 11 lines of letters that start with one very big letter at the top and get smaller and smaller down the chart.
This allows for a clear gradient of visual acuity testing, so it’s easier to pinpoint exactly where a patient’s vision is.
Only specific letters are used on the Snellen Chart, C, D, E, F, L, O, P, T and Z.
These letters were chosen for their clarity and distinctness, so each line is equally readable. This selection helps to maintain the chart’s accuracy and reliability in measuring visual acuity.
When testing visual acuity, the optotypes (letters) on the chart are designed so that the thickness of the lines match the spacing between them. This detail ensures the task is consistent across different lines and levels of the chart.
Patients are asked to cover one eye and read the letters out loud, starting from the top and working down until they can no longer see the letters clearly.
This is then repeated with the other eye, to get a full assessment of both eyes’ visual acuity.
How it Works
Visual acuity testing with the Snellen visual acuity Chart is simple and precise. Patients are asked to read letters from 20 feet away, which is the standard distance.
The goal is to find the smallest text they can read clearly, which measures their visual abilities.
Standard Distance and Setup
The 20 feet distance is important in visual acuity testing. It provides a standard reference point for distance vision, so the letters on the chart are viewed at a scale designed to test clarity accurately. This distance minimizes the effect of accommodation, the eyes ability to focus on near objects which can skew the results if not controlled.
Proper illumination is also essential for accurate visual acuity testing. The room and the Snellen Chart should be well lit, with a brightness level of 80 to 320 candela per square meter, to be optimal.
Reading the Chart
Reading the Snellen Chart starts with the biggest letter at the top, which is usually easy for most patients to read. As they move to smaller letters on the following rows, the task becomes harder, to see how small they can read clearly. This step by step progression is crucial in measuring their visual acuity accurately.
One eye is covered while reading the chart and then the other eye is covered. This way both eyes are evaluated thoroughly and any difference between them is identified.
Corrective Lenses
During TestingPatients can wear corrective lenses during the visual acuity test. This way their corrected vision is measured accurately, to get a true measure of their visual abilities with the best possible corrective lens.
Eye care professionals assess visual acuity in clinical practice while considering factors like lighting and the patient’s current corrective lenses.
As you can see, this full assessment helps to determine if the current prescription is sufficient or needs to be adjusted.
Common Conditions Detected with the Snellen Chart
The Snellen Chart is a commonly used eye chart you can find in an eye doctor’s office. You can use this chart to determine if you have common vision problems. It’s especially useful if you have a refractive error such as myopia, hyperopia or astigmatism.
Myopia (nearsightedness)
If you have myopia or nearsightedness, you can’t see objects clearly at a distance, but you can see objects that are close to you. This is because you have a longer eye than others, so light focuses in front of your retina.
You’re not different, you’re like 40% of US population and if you have children, you should pay attention, because the number of cases is increasing in young people.
However, you may be interested to know that, by the year 2050, you and 52% of the population of the world may be affected with myopia.
If you have a tendency of spending a lot of time in front of a screen or indoors, you are more likely to get myopia. Also, if either of you parent has myopia, you need to be very careful as you might have inherited the genetic tendency.
When you take the Snellen Chart test, you will be able to tell that you have myopia if you are unable to read the smaller letters while standing at the given distance. Also you have several treatment options, you can choose corrective lenses, you might opt for laser surgery, or you could explore new treatments like 7-methylxanthine (7-MX) if you are concerned about the progression of myopia.
In children myopia develops between ages 6 and 14 and may stabilize by early twenties.
Hyperopia (farsightedness)
Hyperopia or farsightedness is when difficulty seeing nearby objects clearly and distant objects may be sharper. This happens when light focuses behind the retina due to a shorter eye or flatter cornea.
In severe cases hyperopia can cause blurry vision at all distances especially when the eyes are tired.
Astigmatism
Astigmatism results from an irregular curvature of the cornea or lens and causes blurry or distorted vision at all distances. This can occur with myopia or hyperopia and affects overall visual clarity.
Patients with astigmatism may struggle to read letters on the Snellen Chart especially the closely spaced or vertical ones. Corrective measures are glasses or contact lenses that counteracts the irregular curvature.
Other visual impairments
The Snellen Chart can also assess other visual impairments like presbyopia and color blindness but may not be enough to detect conditions affecting peripheral vision or depth perception.
How to Interpret Snellen Test Results
Interpreting Snellen test results involves understanding the visual acuity ratio which is the testing distance to the smallest letter size a person can read. This is often expressed as 20/X where 20 is the distance in feet and X is the distance at which a person with normal vision can see the same detail.
For example a visual acuity of 20/40 means a person can see at 20 feet what someone with normal vision can see at 40 feet. This measurement determines the clarity and quality of a person’s vision.
- 20/20 vision: Considered normal visual acuity meaning a person can see clearly at 20 feet.
- 20/40 vision: Means a person can see at 20 feet what someone with normal vision can see at 40 feet.
- Legal blindness: Defined as having a best-corrected visual acuity of 20/200 or less in the better eye.
The smallest line a person can read on the chart is their visual acuity for that eye.
Eye Chart Variations
While the Snellen Chart is widely used, there are several variations designed for different needs.
The Tumbling E chart for instance is for patients to indicate the direction of the letter ‘E’ making it suitable for young children or those who can’t read letters.
Pocket eye charts are another variation designed for quick and easy vision assessment outside clinical settings. These charts increase accessibility for routine checks and emergency situations promoting community eye health.
ETDRS charts provide more precise visual acuity measurement especially for patients with poor vision. They reduce the crowding effect and ensures equal legibility of letters improving testing reliability.
Why Accurate Visual Acuity Measurement Matters
The introduction of the Snellen Chart standardized vision testing and made it uniform across different eye care providers. This standardization became more important during the industrial revolution as good vision was necessary for operating machinery.
Visual acuity testing is a quick procedure that gives immediate feedback on a patient’s vision status. Patients who are legally blind may be eligible for various services including vocational training and Social Security disability benefits.
FDA approval for visual acuity testing often requires the use of ETDRS charts because of their standardized scoring which is not found in Snellen charts.
Common Issues and Myths
One common myth is that 20/20 is the standard for normal vision. In reality 20/20 just means a level that most people with normal eyesight can meet or exceed.
Having different visual acuity levels doesn’t mean poor vision.
Advances in Visual Acuity Testing
Recent advancements in visual acuity testing like the LogMAR chart has improved accuracy and precision. LogMAR provides a more precise way of expressing visual acuity where higher logMAR value means poorer vision.
Newer visual acuity charts can measure the acuity range of 20/100 to 20/200 which is important for proper classification of legal blindness. These advances shows the evolution of vision measurement beyond Snellen methods.
Wrap Up
With all of this in mind, the Snellen Chart has been the standard in visual acuity testing since 1862 when Hermann Snellen created it. Its standardized approach changed the way we care for our eyes and made vision testing consistent and reliable.
As we continue to innovate and improve we will always go back to the Snellen Chart as our foundation in ophthalmology so we can all see better.
FAQs
What is a normal score for the Snellen test?
A normal score for the Snellen test is 20/20, that’s standard vision. In most places 6/6 is the same.
What does 20 40 vision mean on the Snellen chart?
20/40 on the Snellen chart means you can see at 20 what a person with normal vision can see at 40. So your vision is less than average.
How does the Snellen Chart measure visual acuity?
The Snellen Chart measures visual acuity by having you read letters from 20 feet away, the smallest line of text you can read is your visual acuity. This gives a clear picture of your vision.
Can the Snellen Chart detect all vision problems?
This Chart can’t detect all vision problems, it only detects refractive errors and may miss peripheral vision, depth perception or color blindness issues.