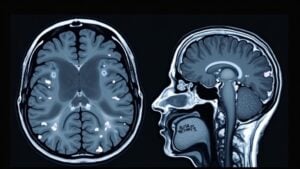
T2 signal abnormalities in the brain appear as bright spots on MRI scans, often hinting at fundamental tissue changes. These hyperintensities frequently seen in white matter can stem from inflammation, fluid buildup, or other disruptions.
While small vessel disease and multiple sclerosis are common culprits, tumors or infections could also play a role. Their appearance, location, and vascular patterns help doctors pinpoint the cause, even if it isn’t always definitive. Comprehending these signals is key to decoding brain health challenges and guiding the next steps forward.
The Basics of T2 Signal Abnormalities in Brain Imaging
T2 signal abnormalities in brain imaging often show up as bright spots on MRI scans, hinting that something could be off. These hyperintensities appear when there’s increased T2 signal intensity on magnetic resonance imaging, suggesting changes in brain tissue, often in white matter.
While not always harmful, they can indicate lesions caused by inflammation, fluid buildup, or other disruptions. T2-weighted images, including specialized sequences like T2 FLAIR, help highlight these areas by suppressing cerebrospinal fluid signals, making abnormalities clearer.
Symptoms like headaches or cognitive changes may accompany these findings, though they don’t always mean serious trouble. Comprehension of these signals helps doctors assess conditions like multiple sclerosis or strokes, guiding further care.
Early detection through imaging can lead to better management, even if the cause isn’t immediately apparent.
Common Pathological Causes of T2 Hyperintensities
White matter lesions often appear as T2 hyperintensities due to changes in myelin integrity or small vessel disease.
Brain tumors could also show T2 signal abnormalities because of increased water content, swelling, or disruption of normal tissue. These findings help identify damage or disease processes affecting brain structure.
White Matter Lesions
Several factors can lead to bright spots, known as T2 hyperintensities, appearing in the brain’s white matter on MRI scans. White matter lesions, or white matter hyperintensities, show up as bright areas on magnetic resonance imaging (MRI), particularly with Fluid Attenuated Inversion Recovery sequences. These spots often appear in the periventricular white matter or deep white matter, suggesting tissue changes.
Common causes include small vessel disease, where tiny blood vessels don’t work properly, reducing oxygen flow. Another cause is multiple sclerosis, where the immune system attacks the protective coating around nerves. While some people have no symptoms, others might notice memory issues or balance problems.
The presence of these lesions helps doctors understand possible fundamental conditions, guiding further evaluation.
Brain Tumor Changes
Brain tumors are another key cause of bright spots seen on T2-weighted MRI scans. These T2 hyperintensities arise from increased water content due to edema, necrosis, or the tumor’s own structure. The appearance varies depending on the type of brain tumor, MRI sequences used, and surrounding tissue changes.
Gliomas: Often show irregular T2 hyperintensity due to their mixed composition, including fluid-filled cavities and infiltrative growth.
Meningiomas: Typically appear as well-defined bright spots with surrounding edema, pressing on adjacent brain tissue.
Metastatic tumors: might display focal T2 hyperintensity, sometimes with edema spreading into nearby areas.
Necrotic regions: Dead tissue within tumors retains fluid, creating intense bright spots on scans.
Interpreting these signals requires comparing multiple MRI sequences and clinical context for accurate diagnosis.
Neuroanatomical Distribution and Patterns of T2 Signal Changes
T2 hyperintense lesions often follow distinct neuroanatomical patterns, with white matter distribution frequently appearing around ventricles or in deep regions.
Gray matter signal changes tend to occur in areas like the basal ganglia or cortex, sometimes linked to metabolic or inflammatory conditions. Vascular territory correlations can help distinguish ischemic causes from other pathologies based on lesion location.
White Matter Distribution Patterns
Damage or changes in the brain’s white matter often show up as bright spots on T2-weighted MRI scans, revealing distinct patterns based on where and how these abnormalities spread. These areas of increased signal intensity can hint at conditions like multiple sclerosis or age-related changes.
- Periventricular Distribution: Bright spots near the brain’s ventricles are common in multiple sclerosis, often appearing as “Dawson’s fingers.”
- Deep White Matter Lesions: Scattered in deeper areas, these can signal small vessel disease or chronic ischemia.
- Subcortical Involvement: Abnormalities here often link to metabolic disorders or autoimmune conditions.
- Perivascular Spaces: Enlarged spaces around blood vessels can mimic signal abnormalities but are usually harmless.
Understanding these patterns helps doctors pinpoint causes, from inflammation to circulation issues, guiding better care without jumping to conclusions.
Gray Matter Signal Changes
While white matter changes often capture the attention, shifts in gray matter can also convey significant messages on T2-weighted MRI scans, reflecting a range of fundamental conditions. Gray matter abnormalities appear as hyperintense signals on T2-weighted MRI images, often linked to Neurological Disorders like multiple sclerosis, where both white and gray matter damage occurs. These changes might indicate inflammation, edema, or neurodegeneration, impacting cognitive and motor functions.
Medical imaging techniques help pinpoint these alterations, offering clues about disease progression. Unlike white matter, gray matter changes often involve deeper brain structures, such as the cortex or basal ganglia. Recognizing these patterns aids in prompt diagnosis and tailored treatment, emphasizing the human brain’s complexity. Comprehending these signals bridges gaps in managing conditions affecting gray matter.
Vascular Territory Correlations
The brain’s vascular system plays a key role in how T2 signal abnormalities appear, with changes often following the paths of blood vessels. On brain MRIs, T2-weighted images highlight areas of increased water content, which can trace back to disruptions in blood flow. These vascular territory correlations help pinpoint where and why Signal Abnormality occurs, especially in white matter.
- Blood Vessel Pathways: T2 changes often align with specific arteries or veins, revealing integral issues.
- White Matter Involvement: Reduced blood flow here can cause bright spots on scans.
- Internal Structures: Damage to deep brain regions could reflect blocked or narrowed vessels.
- Pattern Recognition: Matching abnormalities to vascular maps aids in diagnosing conditions like strokes or small vessel disease.
Understanding these patterns helps doctors link symptoms to their root causes, guiding better treatment.
Clinical Correlations: Symptoms Associated With T2 Signal Abnormalities
Because T2 signal abnormalities show up on MRI scans for many reasons, the symptoms they cause can vary widely depending on their location and fundamental cause. In multiple sclerosis, these findings often reflect inflammation or axonal loss, leading to fatigue, muscle weakness, or vision problems.
For elderly people, small lesions seen as white spots on scans may be linked to aging, sometimes causing slight mental decline or balance issues—though not always. Interpreting T2 signals requires considering potential causes, such as vascular changes or chronic conditions, and understanding critical risk factors like hypertension. Symptoms can range from none to severe, making careful evaluation essential.
While some abnormalities are frequently associated with harmless changes, others could signal treatable conditions. Clarity and context help guide next steps for care.
Technical Aspects of T2-Weighted and FLAIR MRI Sequences
T2-weighted and FLAIR MRI sequences play a key role in uncovering brain abnormalities, helping doctors spot issues that could otherwise remain concealed. These advanced imaging techniques highlight differences in tissue composition, particularly in gray and white matter, by manipulating magnetic resonance imaging (MRI) signals.
T2-weighted images detect fluid-rich areas, making them ideal for spotting abnormal conditions like edema or lesions.
FLAIR imaging suppresses cerebrospinal fluid signals, improving visibility of diseases near fluid-filled spaces.
T2 hyperintensity appears as bright spots, often indicating inflammation, scarring, or other tissue changes.
Clinical applications include diagnosing multiple sclerosis, strokes, and infections by analyzing these subtle contrasts.
Differential Diagnosis of White Matter Hyperintensities
White matter hyperintensities (WMH) show up as bright spots on MRI scans, and while they can look alarming, they don’t always signify serious trouble. These findings on magnetic resonance imaging (MRI) can stem from various causes, including aging, small vessel disease, or diseases like multiple sclerosis.
Increased T2 signal often reflects damage to white matter, whether from inflammation, poor blood flow, or other conditions. Imaging studies help distinguish harmless changes from those associated with cognitive decline or neurological disorders.
Abnormal Brain MRI results could prompt further tests, but WMH can also appear in healthy individuals. Key features like location, size, and pattern guide diagnosis. While they’re linked to risks, not all white matter changes progress or cause symptoms.
Monitoring and Prognostic Value of T2 Signal Changes Over Time
Tracking changes in T2 signal abnormalities over time offers valuable clues about brain health. Serial imaging helps assess progression, treatment response, and the nature of lesions—whether acute or chronic.
Key insights from monitoring include:
- Disease Activity: Worsening hyperintense lesion volume or new lesions suggest active disease, while stability may indicate controlled progression.
- Ischemic Changes: T2-weighted imaging detects subtle ischemic changes, aiding in stroke recovery tracking.
- Distribution Patterns: Certain patterns correlate with cognitive decline, offering prognostic value.
- Treatment Impact: Shrinking lesions or halted growth can confirm effective intervention.
Understanding these dynamics helps predict disease course and tailor management. Whether in multiple sclerosis or vascular disorders, T2 signals serve as critical biomarkers, guiding both diagnosis and long-term care strategies. Regular follow-ups can ensure timely adjustments to therapy.
Conclusion
T2 signal abnormalities in the brain reveal a universe of hidden stories, from subtle white matter changes to more concerning lesions. While these bright spots may spark worry, they often serve as crucial clues rather than definitive doom. Understanding their causes, patterns, and effects empowers better care, turning uncertainty into action. With advanced imaging and careful monitoring, even the most puzzling signals can guide treatment, offering hope where confusion once reigned.